Simulation of microbiological objects fluorescent images
The Ministry of Education
of the Republic of BelarusBelarusian State UniversityEnglish Language
Department for Sciences
of microbiological objects
fluorescent images
CONTENTS
Abstract
Аннотацияof
microbiological objects fluorescent images
ABSTRACT
Key words: confocal microscopy, modelling, automatic
analysis, cells, microbiological objects, cancer.success of digital
technologies in image acquisition has promoted the development of automatic
cytometry - cells and their substructures properties analysis. The efficiency
and robustness of automatic analysis algorithms may be improved by modelling
synthetic images, which allows defining basic features of objects and the
measurement system. This paper proposes a simulation algorithm and its practical
implementation to create fluorescent images of microbiological objects. The
comparison of generated and experimental cancer tumors images confirms their
similarity, which allows using the developed method to study and debug
algorithms.
АННОТАЦИЯ
Ключевые слова: конфокальная микроскопия, моделирование, автоматический
анализ, клетки, микробиологические объекты, рак.
Успехи применения цифровой техники при получении изображений
способствовали развитию автоматической цитометрии - анализа свойств клеток и их
подструктур. Повысить эффективность и устойчивость алгоритмов автоматического
анализа может моделирование синтетических изображений, позволяющее определить
основные свойства объектов и измерительной системы. В данной работе предложен
алгоритм моделирования и его реализация для создания люминесцентных изображений
микробиологических объектов. Результаты сравнения полученных изображений
раковых опухолей с экспериментальными подтверждают их схожесть, что позволяет
использовать предложенный метод при исследовании и отладке алгоритмов.
INTRODUCTION
The success of digital technologies in image acquisition has
promoted the development of automatic cytometry - cells and their substructures
properties analysis. The efficiency and robustness of automatic analysis
algorithms may be improved by modelling synthetic images, which allows defining
basic features of objects and the measurement system [1]. Varying simulation
parameters allows one to study robustness of automatic analysis algorithms to
different influences which appear in the process of image acquisition and to
define the most effecting factors during experiments [2].is a complex process
to simulate images with parameters similar to real features. Nevertheless,
basic features of objects and the measurement system can be studied when some
real objects characteristics are neglected. Furthermore, cell simulation is not
possible without simplifications [2].paper proposes a simulation algorithm and
its practical implementation to create fluorescent images of microbiological
objects. It has allowed producing a list of fluorescent images of cancer
tumors. The statistical analysis was carried out to check the model
significance. The comparison of generated and experimental images confirms
their similarity, which allows using the developed method to study and debug
algorithms.obtained images enable to reveal qualitative morphological system
properties. They can be used to measure certain tissue areas characteristics. A
wide possible simulation parameters list provides generating diverse sets of
images.
SIMULATION
OF MICROBIOLOGICAL OBJECTS FLUORESCENT IMAGES
While modelling the process of image obtaining is divided
into successive stages corresponding to a real experimental procedure using a
fluorescence microscope. At the first stage an ideal image is generated which
consists of specially labelled cells. The simulation result at this stage is an
ideal object. Then the obtained image is distorted due to measurement system
errors: uneven illumination of the object, background autofluorescence, optical
errors, noise from the photomultiplier, etc. Thus, the output is an image which
has properties similar to real fluorescent images [3].type of cell is defined
independently by an appropriate form of cells and their organelles, as well as
by sets of markers that define the texture and colour of these forms. There can
be set dependences between subpopulations which affect the position of cells,
their shape and markers [4]. Then the effects of errors of the measurement system
and the generated ideal image may overlay.first step towards obtaining
synthetic images of cell populations is to define these populations and the
objects they include. These objects are cells that may contain nuclei,
cytoplasm, lipids and other components. To generate shapes of cells and their
organelles a parametric model is used. The shape is defined as a polygon with a
given number of vertices and then the position of certain vertices is modified.
The final shape is obtained by smoothing the contour using cubic spline
interpolation., the peculiarity of this model is that the shape of each object
is generated independently, thus it is necessary to specify the correspondence
between objects belonging to the same cell. It is possible due to the definition
of dependences while setting generation parameters [3]. For example, in order
to make sure that the nucleus gets inside the corresponding cytoplasm, one
should specify the dependence between this nucleus and the cytoplasm that has
already been defined. Otherwise, one can create the shape of a nucleus
independently, but one will have to determine the dependence on this nucleus
when setting the parameters of the cytoplasm. Thus, there are two types of
generated shapes: independent from other objects and associated ones, the
position of which is determined by independent objects. For each of
subpopulations only one type of objects is independent while the others should
be determined.more important factor is how the generated form will look like.
At least one marker able to describe the appearance of the object is required
to solve this problem. The feature of this simulation model is that objects can
be determined not only by some value of intensity of given colour and texture,
but by a number of markers as well. This makes it possible to create visually
complex objects and to generate images very similar to the real ones
[3].definition occurs sequentially, thus it is important to take into
consideration their order. Therefore, all these operations can be divided into
two groups. The first group includes operations establishing the basic level of
the object marker intensity. These markers should be set primarily [3]. This
group includes: a) the marker of a constant intensity level that sets the same
intensity for all pixels of the object based on the Gaussian distribution; b)
the marker the intensity of which is constant, but depends on the density of
objects in the surrounding area; c) the marker which sets a linear dependence
of a constant intensity level on the intensity of another marker in the
specified area; d) the marker which sets the intensity according to the
position of the object on the image in which random texture for the whole image
is determined first and then the average value for the object is calculated.second
group of markers consists of those operations that do not determine the level
of intensity themselves, but only redistribute their value. That is why these
markers should be applied only after definition of baseline intensity using
markers of the first group. The examples of markers changing the intensity
level are angular and linear gradients in any direction; markers that define
the intensity depending on the proximity of borders and other cell organelles;
markers which specify texture with the help of Perlin [2, 5] and turbulent
noise [6]. One more marker in the second group is the marker which can scale
the intensity level in a given range, which may be very useful for enhancing
image contrast.defining the objects properties separately it is important to
consider the parameters that characterize the whole population. These
parameters include the number and arrangement of cells.to various biological
causes cells can be combined into clusters. The determined number Nc
of clusters is evenly randomly distributed in the image with the coordinates (xc,yc).
Cells assigned to a cluster are arranged around the center of the cluster
according to exponential distribution. Thus, cells will be combined into a
cluster with probability pc and distributed uniformly randomly with
probability (1-pc) [2, 3].level of different objects overlapping in
this simulation model is defined as a set of rules that specify possible values
of objects overlapping. The introduction of a number of rules allows not only
acquiring images similar to real experimental ones, but is strongly needed when
working with such a variety of subpopulations and their objects. Another
characteristic related to overlapping is visibility of objects markers that are
compared with the cell. This model provides defining weight coefficients that
determine fractions of the object and the cell.final stage of the modelling
process is to distort the generated ideal image by effects which are observed
in a real measurement system. Within this simulation model such effects as
image illumination distortion, optical aberrations, noise from the
photomultiplier and improper cells staining when labelling [7] may be
observed.illumination distortion is usually caused by the influence of a light
source which leads to an increase in the image intensity. This results in
contrast reduction and displacement of a light source can introduce additional
problems in segmenting objects [6]. In this model image illumination distortion
is defined as an increase of illumination intensity of each image point by a
certain value. Uneven image illumination can also be modelled. In this case
image illumination can be represented by a linear gradient in any direction or
by a radial gradient with the center of a light source at a random point.all
objects are located at the focal plane of the microscope because of
three-dimensional structure of examined samples. This results in blurring some
objects. To add a blurring effect two-dimensional Gaussian blurring is used in
this simulation model which allows transferring data contained in pixels using
Gaussian distribution to the outer zone [5]. This effect is observed as a
result of the Gaussian filter with oversampling - a process of changing
sampling frequency of a discrete (usually digital) signal [5].generate
fluorescent images cells are labelled with special dyes called fluorophores.
However, this treatment may make adjustments to the final image which is
obtained with a microscope. For example, some cells may not be well processed
by the substance, while others can absorb an unexpectedly large amount of a dye
[7]., this simulation model allows generating images of cell populations,
including many different types of cells. Taking into consideration the
dependencies between the synthesized objects allows better recreating the real
picture. In fact, cells and their organelles have a tremendous impact on lives
of each other, which is reflected in the experimental images obtained using a
fluorescence microscope and is the direct object of study. The determined
simulation parameters make it possible to obtain a large number of different
images from the viewpoint of cells and cell populations morphology. A new
approach when setting markers allows generating diverse cellular populations of
a complex visual representation, which is a big advantage of this simulation
model. However, a comparatively short list of opportunities for modelling
experimental conditions a little bit restricts the field where this model can
be implemented.simulation algorithm of modelling fluorescent images of
microbiological objects is based on the theory described earlier. It
corresponds to the classical approach in modelling fluorescent images of
cellular systems, i.e. the process of obtaining an image is divided into successive
stages that occur in the real experiment. Thus, the first step is to create an
ideal image of the cell population. The result is then deliberately distorted
according to the impact of the measurement system and the environment [1, 2].
As a result of these actions the final synthetic image is obtained.generate an
ideal image it is necessary to determine all objects of a given population, to
define how these objects will look and be placed on the image. After completing
these steps for each of the simulated subpopulations it is possible to move on
to the second stage - the introduction of distortion. These stages are shown in
Figure 1 which is worth considering in more detail.
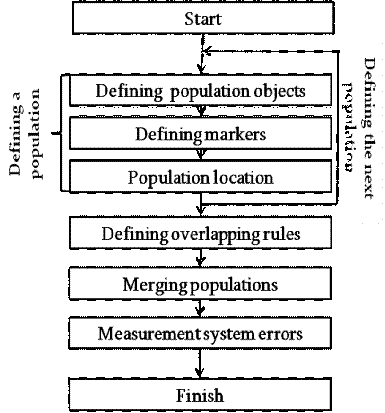 1. Block diagram of the simulation
algorithm
1. Block diagram of the simulation
algorithm
Stage 1. Defining population objects. The first stage in the
process of simulating luminescent images of cellular systems is the
determination of all the objects constituting the system. For each of the
subpopulations the objects and relationships between them must be set. Each
cell organelle must be linked with a specific cell or its nucleus, which in
practice is achieved by directly specifying an anchor of the object. The
definition of each cell or its objects shape using a parametric model with polygons
also takes place at this stage.2. Defining markers. The appearance of
the generated shapes is determined by a set of markers for each object. This
approach helps to create a texture and visual representation of the cell as a
collection of various transformations applied to the basic marker of the
cellular object.
Stage 3. Population location. Location of cells within
the simulated image of the cellular population may be uniform random, but in
real life cells are much more likely to be grouped in clusters. Assigned to the
cluster cells will be located near the predetermined cluster centers, while
other objects will be evenly distributed over the rest of the space.
Stage 4. Defining overlapping rules. Once all the parameters of
the cellular system subpopulations are defined it is necessary to determine the
interaction between these subpopulations. For this purpose a number of
overlapping rules between the objects are defined. Overlaps can occur between
the same objects at the object level of one and the same or different
subpopulations.
Stage 5. Merging populations. The stage of merging
populations is transparent to a user and does not require direct involvement.
After determining all the objects of the cell population their placement in the
final image takes place.
Stage 6. Measurement system errors. This is the final step for
the entire modelling process. Imposition of distortions introduced by the
measurement system and the environment is held at this stage. The output of
this stage is a generated resulting image of the cell population with all
possible errors taken into consideration.
Software that allows generating fluorescent images of
microbiological objects was obtained as a result of realization of an
appropriate simulation algorithm. Figure 2 shows some examples of the obtained
images.similarity of experimental and generated synthetic images is not enough
to ensure adequacy of the developed simulation model and its compliance with
real experimental images. That is why numerical comparison of the available
experimental images of cancer tumors and reproduced synthetic images was drawn.
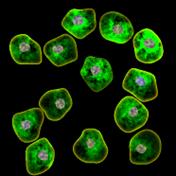
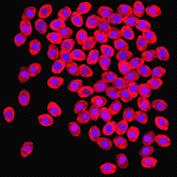
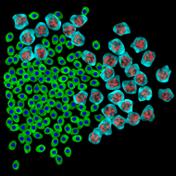
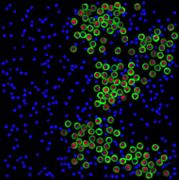
Figure 2. Simulated synthetic images
digital technology microbiological objects
The analysis of the intensity histograms of the affected
cells nuclei on simulated and experimental images in three colour channels was
conducted. The results showed similarity of the images intensity. The χ2 goodness of fit was used
to verify the quality of modelling and showed that the values did not exceed
critical values of χ2 at a significance level of 0.95
indicating that the statistical conditions of χ2 were satisfied., the
equivalent radii of nuclei on the experimental image were compared with those
on the simulated synthetic image. The χ2 goodness of fit was used
again for the objects distribution histogram according to the value of their
equivalent radii to check their conformity with the laws of distribution. The
calculation of χ2 values for 19 degrees of freedom
gave 9.61 which was less than the critical value of χ2 equal to 10.1 at a
significance level of 0.95.the process of cancer tumor cells modelling several
simulation parameters varied. This provided an opportunity to examine how the
simulated image changed depending on the errors of the measurement system.
Measurement system illumination, optical aberrations that lead to blurring of
registered objects, uneven labelling by fluorophores and photomultiplier noise
were chosen as variable parameters. Thus, changing some simulation parameters
allows reaching a wide variety of modelled images, which plays a very important
role due to a great amount of possible experimental conditions.a result of
simulation model practical realization the software package called CellPainter
was implemented for simulating fluorescent images of microbiological objects. This
package includes the simulation algorithm itself, as well as a graphical user
interface that makes it possible to greatly simplify the software application
(Figure 3).provides two different types of interface. The first type of
interface is designed to work with a numerical description of the model
parameters (mode User 1), while the second type of interface allows users to
select values of the model parameters in accordance with the submitted sample
(mode User 2). However, the range of options when working in user mode 2 is
limited and covers only the most important stages of modelling.
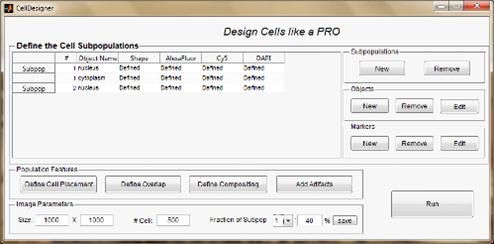
Figure 3. Mode User 1 basic form
CONCLUSION
As the result of this work a simulation model and an image
simulation algorithm have been developed, the primary purpose of which is to
simulate fluorescent images of microbiological objects.developed software
package makes it easy to simulate the necessary synthetic image due to the
implementation of two graphical user interfaces. When working in mode User 1
all simulation parameters have to be entered in numerical form and for mode
User 2 a more user-friendly graphical interface is implemented: one can select
parameters on the basis of the samples offered, but the range of options is limited
and covers only the most important stages of modelling.means of the implemented
application it became possible to reproduce a number of various microbiological
objects fluorescent images, including a series of cancer cells images. To
verify adequacy and consistency of the model the equivalent radii of the
affected cells on the experimental and generated images, as well as the
intensity levels in different colour channels of image elements were
compared.spite of the differences from the experimental images the obtained
synthetic images can reveal qualitative morphological properties of the system
and allow measuring individual characteristics of the simulated tissue and
measuring system. Moreover, a vast list of possible simulation parameters
provides a possibility to generate a wide variety of images.developed
simulation model and application implemented on its basis provide successful
simulation of different biological objects fluorescent images. At the same time
the software has a convenient and user-friendly interface.the future on the
basis of simulation approaches models that characterize not only the location
of cell populations but also their state should be considered. There is a need
to develop a model describing biological processes in the cell, and to
implement a model of an interacting cells layer which are not thoroughly
studied yet.
BIBLIOGRAPHY
1. Feofanov,
A.V. Spectral laser scanning confocal microscopy in biological research / A.V.
Feofanov // Advances of Biological Chemistry / RAC; ed. L.P. Ovchinnikova -
Moscow, 2007. - V. 47, P. 371-400.
2. Computational
framework for simulating fluorescense microscope images with cell populations /
A. Lehmussola [et al.] // IEEE transactions on medical imaging. - 2007. - Vol.
26, №7. - P. 1010-1016.
3. SimuCell:
a flexible framework for creating synthetic microscopy images / S. Rajaram [et
al.] // Nat Methods. - 2012. - №9. - P. 634-635.
4. Altschuler&Wu
Lab [Electronic resourse] / UT Southwestern Medical Center. - Dallas, 2014
. Gonzalez,
R. Digital image processing using MATLAB / R. Gonzalez, R. Woods, S. Eddins. -
Moscow : Technosphere, 2006. - 616 p.
6. Lisitsa,
Y. Fully-automated segmentation of tumor nuclei in canсer tissue images /
Y.Lisitsa [et al.] // Pattern recognition and information processing, Minsk,
18-20 May 2011 / BSUIR - Minsk, 2011. - P. 116-120.
. Karnaukhov,
V.N. Fluorescent analysis of cells / V.N. Karnaukhov; ed. A.Y. Budanceva -
Puschino: Analytical microscopy, 2002. - 130 p.
GLOSSARY
|
1.
|
aberration
|
аберрация
|
|
2.
|
absorption
|
поглощение
|
|
3.
|
acquisition
|
получение
|
|
4.
|
adaptive boosting
|
адаптивное стимулирование
|
|
5.
|
adjacent cells
|
смежные клетки
|
|
6.
|
algorithm
|
алгоритм
|
|
7.
|
analytical representation
|
аналитическое представление
|
|
8.
|
angular gradient
|
угловой градиент
|
|
9.
|
application
|
приложение
|
|
10.
|
approach
|
подход
|
|
11.
|
approximation
|
аппроксимация
|
|
12.
|
arrangement
|
расположение
|
|
13.
|
artifact
|
артефакт
|
|
14.
|
artificial image
|
искусственное изображение
|
|
15.
|
automated analysis
|
автоматический анализ
|
|
16.
|
background
|
фон
|
|
17.
|
basic components
|
основные компоненты
|
|
18.
|
bias
|
смещение
|
|
19.
|
bioinformatics
|
биоинформатика
|
|
20.
|
bleeding
|
испускание
|
|
21.
|
blurring
|
размытие
|
|
22.
|
border
|
граница
|
|
23.
|
bound
|
граница
|
|
24.
|
calculation
|
вычисление
|
|
25.
|
cancer
|
рак
|
|
26.
|
cell
|
клетка
|
|
27.
|
cell activity
|
клеточная активность
|
|
28.
|
cell types
|
типы клеток
|
|
29.
|
channel
|
канал
|
|
30.
|
chemotaxis
|
хемотаксис
|
|
31.
|
chromosome
|
хромосома
|
|
32.
|
classification
|
классификация
|
|
33.
|
cluster
|
кластер
|
|
34.
|
color space
|
цветовое пространство
|
|
35.
|
combination
|
сочетание
|
|
36.
|
composite
|
смесь
|
|
37.
|
compression
|
сжатие
|
|
38.
|
computer graphics
|
компьютерная графика
|
|
39.
|
concentration
|
концентрация
|
|
40.
|
configuration
|
конфигурация
|
|
41.
|
confocal microscope
|
конфокальный микроскоп
|
|
42.
|
conformity
|
соответствие
|
|
43.
|
constraint
|
ограничение
|
|
44.
|
contamination
|
загрязнение
|
|
45.
|
continuity
|
непрерывность
|
|
46.
|
contour roughness
|
неровность контура
|
|
47.
|
contrast
|
контрастность
|
|
48.
|
conversion
|
конвертирование
|
|
49.
|
convex hull
|
выпуклая оболочка
|
|
50.
|
convolution
|
конволюция
|
|
51.
|
coordinate
|
координата
|
|
52.
|
correlation
|
корреляция
|
|
53.
|
correspondence graph
|
граф соответствия
|
|
54.
|
criterion
|
критерий
|
|
55.
|
curvature
|
кривизна
|
|
56.
|
cytometry
|
цитометрия
|
|
57.
|
cytoplasm
|
цитоплазма
|
|
58.
|
dark-field microscopy
|
темнопольная микроскопия
|
|
59.
|
data mining
|
интеллектуальный анализ
данных
|
|
60.
|
deconvolution
|
деконволюция
|
|
61.
|
deficiency
|
нехватка
|
|
62.
|
deformation
|
деформация
|
|
63.
|
degradation
|
вырождение
|
|
64.
|
demonstration
|
демонстрация
|
|
65.
|
dependence
|
зависимость
|
|
66.
|
deployment
|
размещение
|
|
67.
|
depth
|
глубина
|
|
68.
|
detection
|
выявление
|
|
69.
|
deviation
|
отклонение
|
|
70.
|
digital camera
|
цифровая камера
|
|
71.
|
digital signal
|
цифровой сигнал
|
|
72.
|
dilatation
|
дилатация
|
|
73.
|
dimension
|
размерность
|
|
74.
|
direction
|
направление
|
|
75.
|
discrete signal
|
дискретный сигнал
|
|
76.
|
displacement
|
смещение
|
|
77.
|
distinction
|
различие
|
|
78.
|
distortion
|
искажение
|
|
79.
|
distribution
|
распределение
|
|
80.
|
DNA
|
ДНК
|
|
81.
|
dye
|
краситель
|
|
82.
|
dynamics
|
динамика
|
|
83.
|
edge
|
край
|
|
84.
|
efficiency
|
эффективность
|
|
85.
|
eigenvalue
|
собственное значение
|
|
86.
|
electron microscopy
|
электронный микроскоп
|
|
87.
|
emission
|
эмиссия
|
|
88.
|
empirical evidence
|
эмпирическое свидетельство
|
|
89.
|
emulation
|
эмулирование
|
|
90.
|
enumeration
|
перечисление
|
|
91.
|
equalization
|
выравнивание
|
|
92.
|
equation
|
уравнение
|
|
93.
|
equidistant sampling
|
равноудаленная выборка
|
|
94.
|
equivalent radius
|
эквивалентный радиус
|
|
95.
|
erosion
|
эрозия
|
|
96.
|
Eulerian formulation
|
формулировка Эйлера
|
|
97.
|
evaluation
|
оценка
|
|
98.
|
expression
|
экспрессия
|
|
99.
|
extension
|
расширение
|
|
100.
|
extreme point
|
точка экстремума
|
|
101.
|
factor
|
фактор
|
|
102.
|
feature
|
характерная черта
|
|
103.
|
filtration
|
фильтрация
|
|
104.
|
fine structure
|
тонкая структура
|
|
105.
|
fitting
|
подгонка
|
|
106.
|
flexible contour
|
|
107.
|
fluorescence
|
флуоресценция
|
|
108.
|
flux
|
поток
|
|
109.
|
focal plane
|
фокальная плоскость
|
|
110.
|
focus
|
фокус
|
|
111.
|
Fourier series expansion
|
разложение в ряд Фурье
|
|
112.
|
frame
|
кадр
|
|
113.
|
framework
|
фреймворк
|
|
114.
|
gene
|
ген
|
|
115.
|
generation
|
генерация
|
|
116.
|
goodness of fit
|
критерий согласия
|
|
117.
|
graphic user interface
|
графический
пользовательский интерфейс
|
|
118.
|
grayscale image
|
полутоновое изображение
|
|
119.
|
halfspace
|
полупространство
|
|
120.
|
hierarchical clustering
|
иерархическая кластеризация
|
|
121.
|
high-speed pipeline
|
высокоскоростной источник
информации
|
|
122.
|
histogram
|
гистограмма
|
|
123.
|
hyperbolic manifold
|
гиперболическое множество
|
|
124.
|
hyperplane
|
гиперплоскость
|
|
125.
|
identification
|
опознавание
|
|
126.
|
image
|
изображение
|
|
127.
|
image mask
|
маска изображения
|
|
128.
|
image pre-processing
|
предобработка изображений
|
|
129.
|
image registration
|
регистрация изображения
|
|
130.
|
impulse
|
импульс
|
|
131.
|
incremental algorithm
|
пошаговый алгоритм
|
|
132.
|
indicator
|
индикатор
|
|
133.
|
infrared analysis
|
инфракрасный анализ
|
|
134.
|
input
|
входные данные
|
|
135.
|
intensity
|
интенсивность
|
|
136.
|
intercellular contacts
|
внутриклеточные контакты
|
|
137.
|
interference
|
интерференция
|
|
138.
|
interpolation
|
интерполяция
|
|
139.
|
intersection
|
пересечение
|
|
140.
|
irregularity
|
неравномерность
|
|
141.
|
iteration
|
итерация
|
|
142.
|
kernel
|
ядро
|
|
143.
|
k-means clustering
|
кластеризация методом
k-средних
|
|
144.
|
label
|
метка
|
|
145.
|
Lagrangian formulation
|
формулировка Лагранжа
|
|
146.
|
laser
|
лазер
|
|
147.
|
light source
|
источник света
|
|
148.
|
light-field microscopy
|
светлопольная микроскопия
|
|
149.
|
limitation
|
ограничение
|
|
150.
|
linear gradient
|
линейный градиент
|
|
151.
|
link
|
связь
|
|
152.
|
localization
|
локализация
|
|
153.
|
location
|
расположение
|
|
154.
|
locomotion
|
передвижение
|
|
155.
|
luminescence
|
люминесценция
|
|
156.
|
machine learning
|
автоматическое обучение
|
|
157.
|
mapping
|
отображение
|
|
158.
|
marker
|
маркер
|
|
159.
|
matrix
|
матрица
|
|
160.
|
mean
|
среднее значение
|
|
161.
|
measurement system
|
измерительная система
|
|
162.
|
merging
|
слияние
|
|
163.
|
microarray
|
микромассив
|
|
164.
|
migration
|
перемещение
|
|
165.
|
misalignment
|
смещение
|
|
166.
|
modeling
|
моделирование
|
|
167.
|
morphology
|
морфология
|
|
168.
|
motility
|
подвижность
|
|
169.
|
movement
|
движение
|
|
170.
|
multichannel representation
|
многоканальное
представление
|
|
171.
|
multispectral video
|
многоспектральное видео
|
|
172.
|
naked eye
|
невооруженный глаз
|
|
173.
|
neighbourhood
|
соседство
|
|
174.
|
nondegenerate solution
|
невырожденное решение
|
|
175.
|
nucleus
|
ядро
|
|
176.
|
numerical aperture
|
числовая апертура
|
|
177.
|
numerical method
|
численный метод
|
|
178.
|
objective
|
объектив
|
|
179.
|
objective function
|
целевая функция
|
|
180.
|
observation
|
наблюдение
|
|
181.
|
octave
|
октава
|
|
182.
|
optical diffraction
|
оптическая дифракция
|
|
183.
|
organelle
|
органелла
|
|
184.
|
orientation
|
ориентация
|
|
185.
|
outlier
|
выброс
|
|
186.
|
outline
|
контур
|
|
187.
|
output
|
выходные данные
|
|
188.
|
overlap
|
перекрывание
|
|
189.
|
oversampling
|
передискретизация
|
|
190.
|
package
|
пакет
|
|
191.
|
parameter
|
параметр
|
|
192.
|
parametric model
|
параметрическая модель
|
|
193.
|
pattern
|
шаблон
|
|
194.
|
pattern recognition
|
распознавание образов
|
|
195.
|
Perlin noise
|
шум Перлина
|
|
196.
|
persistence
|
стойкость
|
|
197.
|
phase
|
фаза
|
|
198.
|
photoactivation
|
фотоактивация
|
|
199.
|
photobleaching
|
фотообесцвечивание
|
|
200.
|
photomultiplier
|
фотоэлектронный умножитель
|
|
201.
|
pixel
|
пиксель
|
|
202.
|
plasticity
|
гибкость
|
|
203.
|
platform
|
платформа
|
|
204.
|
plugin
|
плагин
|
|
205.
|
polar angle
|
полярный угол
|
|
206.
|
polarity
|
полярность
|
|
207.
|
polytope
|
многогранник
|
|
208.
|
population
|
популяция
|
|
209.
|
precision
|
точность
|
|
210.
|
probe
|
проба
|
|
211.
|
proximity
|
близость
|
|
212.
|
quality characteristics
|
качественные характеристики
|
|
213.
|
quantification
|
квантование
|
|
214.
|
queue
|
очередь
|
|
215.
|
quickhull partitioning
|
разбиение методом быстрых
оболочек
|
|
216.
|
random model
|
произвольная модель
|
|
217.
|
random permutation
|
случайная перестановка
|
|
218.
|
random polygon
|
произвольный полигон
|
|
219.
|
randomization
|
рандомизация
|
|
220.
|
randomness
|
случайность
|
|
221.
|
range
|
диапазон
|
|
222.
|
ratio
|
отношение
|
|
223.
|
ray
|
|
224.
|
reconstruction
|
реконструкция
|
|
225.
|
recovery
|
восстановление
|
|
226.
|
refraction
|
рефракция
|
|
227.
|
regulation
|
регулирование
|
|
228.
|
resolution
|
разрешение
|
|
229.
|
restoration
|
восстановление
|
|
230.
|
RNA
|
РНК
|
|
231.
|
robustness
|
прочность
|
|
232.
|
sampling frequency
|
частота дискретизации
|
|
233.
|
scale
|
шкала
|
|
234.
|
section
|
раздел
|
|
235.
|
segment
|
сегмент
|
|
236.
|
segmentation
|
сегментация
|
|
237.
|
sensitivity
|
чувствительность
|
|
238.
|
sequence
|
последовательность
|
|
239.
|
signal-noise ratio
|
отношение сигнал/шум
|
|
240.
|
simplification
|
упрощение
|
|
241.
|
simulation
|
симуляция
|
|
242.
|
smoothness
|
гладкость
|
|
243.
|
Sobel operator
|
оператор Собеля
|
|
244.
|
software
|
программное обеспечение
|
|
245.
|
solution convergence
|
сходимость решения
|
|
246.
|
source code
|
исходный код
|
|
247.
|
spatial location
|
пространственное
расположение
|
|
248.
|
specification
|
спецификация
|
|
249.
|
spectrometry
|
спектрометрия
|
|
250.
|
spline
|
сплайн
|
|
251.
|
splitting
|
расслаивание
|
|
252.
|
spot
|
пятно
|
|
253.
|
spread
|
распространие
|
|
254.
|
staining
|
окрашивание
|
|
255.
|
stationery sensor
|
неподвижный датчик
|
|
256.
|
statistical conditions
|
статистические условия
|
|
257.
|
statistics
|
статистика
|
|
258.
|
stream
|
поток
|
|
259.
|
subcellular components
|
субклеточные компоненты
|
|
260.
|
subpopulation
|
субпопуляция
|
|
261.
|
successive stages
|
последовательные стадии
|
|
262.
|
supervised learning
|
контролируемое обучение
|
|
263.
|
surface
|
поверхность
|
|
264.
|
symmetry
|
симметрия
|
|
265.
|
synthetic image
|
синтетическое изображение
|
|
266.
|
tag
|
метка
|
|
267.
|
target
|
цель
|
|
268.
|
technique
|
техника
|
|
269.
|
temporal variation
|
временное отклонение
|
|
270.
|
tensor
|
тензор
|
|
271.
|
texture
|
текстура
|
|
272.
|
thickness
|
толщина
|
|
273.
|
three-dimensional structure
|
трехмерная структура
|
|
274.
|
threshold
|
порог
|
|
275.
|
throughput
|
пропускная способность
|
|
276.
|
tissue
|
ткань
|
|
277.
|
topological flexibility
|
топологическая гибкость
|
|
278.
|
tracking
|
отслеживание
|
|
279.
|
trajectory
|
траектория
|
|
280.
|
transfer
|
перенос
|
|
281.
|
transformation
|
преобразование
|
|
282.
|
treatment
|
обращение
|
|
283.
|
triangulation
|
триангуляция
|
|
284.
|
tumor
|
опухоль
|
|
285.
|
turbulent noise
|
турбулентный шум
|
|
286.
|
usage scenario
|
пользовательский сценарий
|
|
287.
|
validation
|
подтверждение
|
|
288.
|
value
|
величина
|
|
289.
|
variance
|
дисперсия
|
|
290.
|
vector
|
вектор
|
|
291.
|
verification
|
верификация
|
|
292.
|
versatility
|
гибкость
|
|
293.
|
vertice
|
вершина
|
|
294.
|
viewing condition
|
условия просмотра
|
|
295.
|
visual appearance
|
внешнее представление
|
|
296.
|
visualization
|
визуализация
|
|
297.
|
Voronoi diagram
|
диаграмма Вороного
|
|
298.
|
watershed segmentation
|
сегментация методом
водоразделов
|
|
299.
|
wavelet
|
вейвлет
|
|
300.
|
weighted sum
|
взвешенная сумма
|