Financial bubble
Table of contents
Introductiondescription
of methods and key figures of financial bubblesliterature and the
contentmethods of predicting financial bubbles
Introduction
subject of this research is the prediction of «financial
bubbles». bubble is such a phenomenon on the financial market, when the
assessments of people exceed the fair price. If this phenomenon is considered
graphically, it could be characterized by a sharp deviation of course of good
up from historical trend with the following collapse. This phenomenon could be
recognized only by analyzing the market data, which makes the financial bubbles
being very hard to predict. However, there are some typical features of
occurrence of financial bubbles, due to which they could be distinguished from
an ordinary rise of a price. There are two types of financial bubbles, which
are necessary to separate. The first type occurs due to attempts to eliminate
the lack of financial package. The second one appears, on the contrary, when
there is an assurance that some sector would be successful, and investments,
which are put in this sector, effect oppositely.theme is chosen because
nowadays there are no effective methods of predicting and preventing the
financial bubbles. There are different diverse perceptions and methods, based
on previous observations, which can show some suspicious trends on markets.
However, the state of the market could not be estimated only by analyzing share
prices, because the information about the activity of different companies is
mostly classified. theme has become significantly relevant during the last two
decades. This might happen due to the fact that nowadays more and more
stock-jobbers (speculators), who have the access to the market, earn on the
differences in prices, which leads to the «swinging» of the market. In addition
to this, it should be mentioned that during this period two financial bubbles
took place: the USA subprime mortgage bubble (crisis) and, so called, the
dot-com bubble.
The purpose of this research is to examine and to analyze
comprehensively methods of predicting the emergence of financial bubbles, as
well as figuring out the ways of development this methods.is also necessary to
solve the following problems:
To examine the financial bubble from the point of
time series analysis;
To examine the structure and the causes from the
point of the institutional analysis;
To work out methods of predicting and their use in
different situations;
To draw a conclusion concerning these methods and to
structure the information.this moment, it is difficult to find particular
methods of predicting the emergence of financial bubbles in the literature,
since the topic is variable and there are many factors which begin to appear
and influence the current system. That is why, it is necessary to keep the
relevance of collected base of predicting methods, as well as enriching this
base with new and developed methods. In connection to this, the problems, which
are being solved in this research, would be of great current interest and
new.paper (draft) describes the theoretical base of the future research,
explains the basic definitions and operations taking place in the market.
Moreover, it gives the full description of analysis tools and their
applicability to the stated problems. Then, there is given a review of used
literature on this topic, which is followed by the detailed plan of the
research with the description of each item.
The description of methods and key figures of
financial bubbles
paper examines several approaches as to the predicting of
financial bubbles as well as to the process of their occurrence. The basic two
approaches are mathematical and institutional. Mathematical approach is
necessary to search regularities, the reasons of occurrences and general
features of financial bubbles. In this case, the entire model would be strictly
mathematical, and the market would be considered only as the time series. On
the other hand, institutional approach describes all the factors from the point
of causes and consequences. This allows to make the approach of reasons of
financial bubbles’ occurrence more comprehensive, which provides at the same
time the ability to predict this phenomenon in more detail.of all, it is
necessary to analyze financial bubbles from the point of institutional
analysis. This means that it should be defined what influences on their
occurrence. In this paper it is supposed that there are two types of «bubbles»,
which both occurs under the influence of a single factor - moral hazard.first type
of the bubbles appears because of the attempt of eliminating the lack of
financing. The second one occurs, by contrast, when some sector is believed to
be successful, so all the money is invested in it, because it is considered to
be the best investment at the moment. first case takes place when an agent
borrows money for the further operation, but practically all the investments go
to cover the previous debts. There are a lot of examples of this case when an
absolutely legitimate organization becomes a kind of financial pyramid. Often
this happened to the states. As a matter of fact, investors were sure in the
timely assistance of the state’s economy by the IMF, in which they invested
their money. However, the assistance had not been provided, which, consequently,
led to the fact that states were forced to declare a default. However, if the
investors had not been sure in the assessment of the IMF, they would not have
invested the money, so there would not have been the main prerequisite for
financial pyramid to have appeared. In such a way, yet being with debts the new
investments would be borrowed on covering these debts, but the economy would be
still in its normal state. In this particular case, it is the moral hazard,
which leads the situation to occurrence of a financial bubble. The state, which
is confident in the support in any situations, especially if its economy is
greatly important for the world economy as a whole, takes the support for
granted, because the funds are often spent inefficiently. That is why the
funds, aimed at the recovery of the economy, are rarely directed to the
appropriate sectors and thereby the government is forced to borrow more money
to cover the expiring debts. second case is caused by the other situation,
which is characterized by the occurrence of «bubbles» under favorable
conditions. In the other words, this could be defined as speculative bubble.
Usually the emergence of such a bubble is connected with the overrated
expectations of investors. It should be mentioned that such bubbles occurs
generally on new markets that is followed by the fact that future income is
overestimated. Investors are confident in the success of an exact sector and
the rates jump up, but after certain events there comes a moment of frustration
and rates fall to a minimum. Such bubbles have several stages. The first stage,
so called sample, lies in the fact that the first invested companies show good
figures. The second stage or the beginning of the bubble happens after a while,
when there is an assurance in the benefits of investments. The euphoria is the
third stage, during which there is an active speculation on the market, which
leads to the increase of shares prices by several times. All these stages are
usually followed by quit conditions and, as a result of unrealized
expectations, the bubble crashes. The main reason of this phenomenon, according
to the institutional analysis, is also the moral hazard. The investors’ risks
lie only on the companies whose shares are traded on markets. In addition to
this, it is necessary to consider not only the stock market, but the situation
in general and prices on the market. the financial bubble is considered from
the point of view of mathematical models, it is the excess of the market value
of assets over their fundamental value. This means that the asset at the moment
of the bubble costs much more dividends for the period of time than other
ordinary asset in relation to the dividend for the same period of time. Thus,
it is possible to win on such an asset in two cases, firstly, if the price
increases, the asset should be sold, and secondly, if investors ' expectations
are satisfied, so that dividends reach the necessary level. There are three
types of investors. The first type is those, who hold assets and earns on
dividends from these assets. The second type of investors speculates asset and
makes a profit on the price difference. The third type does not adhere to
specific strategies and only follow the market trends. Moreover, the third type
is the irrational part of investors, who only stronger swing the market. The
second type supports the trends of the third type and, by this, increases the
tendency in order to earn money on the difference.
Rational investors own the asset, mainly with the purpose of
reception of dividend income. They compare in each moment of time the current
value of the asset with its fundamental value. Following this, the expectation
of rational investors can be represented as follows:
financial bubble price market
E1(Pt+1)=Pt+λ(P*−Pt)+εt
λ - Parameter, which
characterizes the speed of adjustment of the current price of the asset to its
fundamental value;
εt - normally distributed
random variable, which characterizes the influence ofnews shocks on the
expected value of the asset,,
εt ~ N (0,σ
2 ) , it is
important to mention, that the random variable characterizes changes
particularly in the expectations, but not in the actual cost of an asset.
Pure speculators focus mainly on reception of income from
capital gains, while believing that the other participants of the market have
similar settings. It is profitable for speculators to maintain the current
market trend. Their expectations could be represented as follows:
E2(Pt+1)=Pt+ AMOUNTS wi(Pt-i-Pt-i-1)+εt
> 0 - coefficients, which characterize the sensitivity to
past changes in prices, and decrease as remoteness of a past moment of time.
Noise traders do not build their own expectations. They make their actions in
the market on the basis of the aggregate actions of the other participants. In
other words, they are oriented on the dominant trend in making the decisions.
In each period these are the rational investors and speculators, who make the
first actions, and only then the noise traders do. Dynamics of the asset is set
by cumulative actions of all three types of investors with the significant
dependence on the values of exogenously specified parameters. this case, the
proposed model allows stimulating the dynamic of the asset course considering
both rational and behavior components in the actions of investors. Besides, an
important role is played by the influence of different news shocks, which allow
stimulating so called «contagious crisis» and stimulating the impact on the
dynamics of the value of the assets, on changes of ratings of borrowing
capacity of the states and others. on the conditions of occurrence of financial
bubbles and their further dynamics it is possible to separate the following
kinds of bubbles.first group is speculative bubbles, which could also be called
as traditional or non-rational. In this case the asset is acquired because the
investor expects further rise of prices, but his expectations are not based on
objective changes in the fundamental figures. second group is rational bubbles.
In most studies, which are based on the rational expectations theory, a general
definition is contained: a rational bubble is the difference between the market
price and the price, which is based on the fundamental components.is the most
common approach, in which the bubble is determined on the basis of the
efficient market hypothesis (EMH). Moreover, this approach is used in most of
the surveyed further variants of the empirical tests for the presence of the
bubble.us consider the determination of stock profitability in the period t + 1
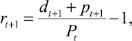 (1),
(1),
where r t+1 - is the share profitability in a
future period, which equals the ratio of revenues from shares in a future
period, which consist of dividends to be paid d t+1 and income from the sale of
shares at end of period p t+1 minus the share price in the base year, to the
value of the shares in the base year Pt.
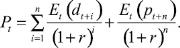
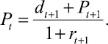 (2)
(2)
Thus, the share price is determined by discounting of the
expected future cash flows - dividends and share value when selling in the
future. the conditions of uncertainty the share price would depend on as the
expected dividends and the value of the sale, as well as expected
profitability. To indicate the expected values of a given indicator on the
basis of all the information available in period (T - Ωt), the measure of
conditional mathematical expectations Et(...) would be used.
Let us write the formula (2) with the
use of conditional mathematical expectations:
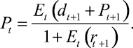 (3)
(3)
Formula (3) is the base for
determining the fundamental value of the share, from which it begins the
consideration of the bubbles on the stock market in a number of works, such as:
Leroy (LeRoy, 2004), Schiller (Shiller, 1981, 2000), Watson (Watson, 1981),
'dib, Grossman (Diba, Grossman, 1983), Evans (Evans, 1991).formula is based on
the following assumptions:
running assumption of rational
expectations;
the absence of asymmetric
information;
investors are risk-neutral;
level of profitability is constant
and does not vary in time., the formula (3), which determines the value of the
asset at time t, could be presented taking into account the requirements listed
above, where profitability (r) is constant in time.
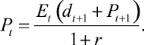 (4)
(4)
subsequent periods of time the
equation (4) could be written as follows:
 (5)
(5)
(5) consists of two components: the
first one represents the discounted amount of future dividends, and the second
is the expected discount value of the sale shares in the future.the theory of
rational bubbles the components of the price of the shares are separated as
follows:

part of the price, which is determined by fundamental
factors;
 - bubble-component
, the value of a share is a simple
sum of the fundamental value and a part of the bubble. The general solution of
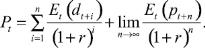
these equations could be represented as follows:observed (current) price of the
asset = fundamental value + a rational bubble. More precisely this equation
could be expressed as:
= Ft + Bt. (6)
is obvious that the rational bubble
is always a part of the price of the shares.the expression (6) is substituted
instead of the Pt in the formula (4), using the definition of a fundamental
component and a bubble, the equation (7) will be obtained, which shows that the
bubble is growing at a rate r.
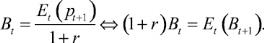 (7)
(7)
 (8)
(8)
The aspiration of the n in infinity
limit tends to zero, and, accordingly to this, the bubble-component disappears,
and the stock price at time t is determined only by the dynamics of
dividend.(8) shows that the current price of the asset in any period is
determined by the current fundamental factors of the period and the supposed
gain or loss of capital depending on the condition of the asset until the next
period. This reflects the rational expectations, as the expectation is the
mathematical expectation of change of the price of an asset, based on all
currently available information.
The literature and the content
theme of the future research is the
predicting the financial bubbles. It will consist of three main parts. The
first part is the theoretical one and it will describe the well-known basic
information and the methods which will be used during the work on this paper.
In the second part, the all relevant information about the
forecasting of financial bubbles will be collected. This will help in assessing
the effectiveness and finding the optimal path of the detection of bubbles in
the third part. The main methods of forecasting will be provided on the basis
of the works on forecasting of financial bubbles in Russia based on the system
of cyclical indicators of the Development Center, leading indicators for the
system of Forni, Hallin, Lippi&Reichlin and diffusion indices. All of this
is described in the article by Demidov, Oleg (2008). “Different indexes for
forecasting economic activity in Russia,” Quantile, No.5, pp. 83-102.
In addition to this, various methods used in the forecasting
will be discussed, such as the index of skyscrapers, or the methods applied in
the United States, which were described in Lux, T. Herd Behaviour, Bubbles and
Crashes // Economic Journal, 1995,
Two methods of predicting financial bubbles
order to support the economy of the country and to prevent
the occurrence of the next crisis, it is necessary to be able to identify when
and where the bubble could inflate, and mostly important, how it will deflate
and what it will be followed by. The sharp rise and fall of prices could
eventually lead to the collapse, which would be followed by a crisis period.
The first financial bubbles described by historians and economists were known
as tulipomania which took place in the XVII - th century in Netherlands, and
the excitement for South Sea Company in 1720 -s in England. In each historical
period the bubble inflation was connected with the «financialization», which is
the accumulation of the excess capital and shifting of the directions of its
investments to the production sphere in the direction of financial markets and
speculation. In many countries of the world the «financial bubbles» inflate and
blown away constantly. All this can lead to another crisis, and that is why
analysts analyze markets every day, provide different kinds of forecasts,
trying to do everything possible to prevent negative consequences. following
are two types of predicting the financial bubbles. One of them is based on the
mathematical judgments, and the other one is just conformity. order to
represent the calculations in this paper, the methods of fractal analysis would
be the mathematical apparatus of this work. The processes of accumulation of a
crisis potential in the foreign exchange market were studied with the help of
the method of exclusion trends (Detrended fluctuation analysis, further - DFA),
allowing to establish the dependence of the current value of the study variable
from the previous ones. Method DFA is a well-known mean of research of
relationships in the time series, and has been successfully applied in various
scientific fields (physics, medicine, etc.). As an indicator, calculated by the
method of DFA and describing the interdependence between the values of the
variable in different periods of time, it is used index Peng (fractal).is
proved by the methods of mathematical analysis that if the index Peng stock
index (the exchange rate and etc.) takes the value of 1.5, the increment in the
appropriate time series are independent among themselves, and the market is in
an efficient state. In other words, it is in the state, which excludes the
possibility of deriving profit from speculative activities on it. The deviation
of the index Peng of the value of 1.5 in larger (smaller) sides testifies the
positive (negative) correlations of data that means the inefficiency of the
financial market.the economic point of view, a significant and longstanding
deviation of the index Peng stock index (the exchange rate etc.) from the value
of 1.5 on the big side can be interpreted as an increase of the speculative
«bubble» in the market, characterized by euphoria among economic agents (the
optimistic mood of market participants). It should be mentioned that the
economic agents more guided by short-term interests and motives of profit than
the long-term strategy of productive output.reverse case (i.e. when the index
Peng significantly less than the value of 1.5 a) corresponds to a situation in
which economic agents are not sure about the prospects for the further growth
of the financial market (pessimistic mood). As a result, the market may
increase the volatility of financial indicators, which increases the
uncertainty of the functioning of not only the financial sector, but also the
industrial process is undermined by the possibility of long-term strategic
planning, requiring significant expenses for insurance of risks, etc.). , a
significant deviation of the index Peng of the value of 1.5 indicates the
presence of a crisis potential economic system.the one hand, financial bubbles
could be defined in the mathematical way that is a fairly reliable method;
however, on the other hand, no mathematical model could give all the details,
so the financial bubbles are being tried to predict from the various
parties.the identification of different financial bubbles at the present time a
great number of complex models has been created, and a lot of different
parameters are also used, starting with the curiosities of human behavior and
ending with ornithology. In his latest analysis Barclays Capital presented to
the general public Skyscraper Index, which indicates the still unfavorable
correlation between the highest buildings in the world, located in the stage of
readiness, with the subsequently following economic crisis. The study confirmed
the hypothesis that the construction of such buildings coincides in time with
the present manifestation of the crisis, the scope of which, to some extent, is
determined by the height and the number of such buildings.material for
confirmation of correctness of Index skyscrapers is enough. The highest
building of its time 40 Wall Street and the Chrysler Building were built in the
first years of the great depression of the 1930s, which also marked the end of
the boom that followed the First World War. The buildings of the early 1970s,
One World Trade Centre, Two World Trade Centre and The Sears Tower coincided in
time with the period of the large-scale currency speculating, the collapse of
the Bretton woods system, and the economic recession of the world economy,
followed by the raising of the OPEC oil prices. The appearance of the highest
building in the world in Kuala Lumpur of the Petronas Towers (1997) that was
made for the first time outside the United States marked a serious economic
crisis in Asia, as well as the collapse of the financial systems of the region.
The highest building of all times - the Burj Khalifa, was built in October 2009
in Dubai, i.e. in fact, during the recent economic recession. Fortunately, at
the present time there is being built no building, able to compete with the
Dubai skyscraper. However, according to the Barclay’s theory, it should not be
limited to only a height of buildings, but it is also necessary to take into
account the number of the buildings, which are in the stage of construction.
Here and now the attention should be paid to China, which is showing signs of
overheating. At present in China, it has been built 53% of all the skyscrapers
of the world, and the total number of skyscrapers in the country will grow for
the next six years by 87%. It is also India, which causes anxiety by planning
to build the second tallest skyscraper in the world to 2016-th year, which will
be called the Tower of India.
Conclusion
conclude, the problem, which is considered in this paper, is
extremely relevant in modern conditions. The frequency of crises in various
countries increases, as well as the number of bubbles in different markets
does, but new crises have not been able to avoid because of absence of
sufficient knowledge base and targeted well-timed action. That is why this
direction will be developed over a long term of years.availability of this work
is also as high as its relevance. This work can be helpful not only to
economists of the Central Bank, but also to the investors, who want to evaluate
the state of the market, in which it is planned to invest. Thus the study of
this area brings to the market players rationality, thereby increasing public
wealth.